Dong Chen, Head of Asia Macroeconomic Research Pictet Wealth Management.
- Most indicators for Chinese economic activities in October continued to improve. Growth in nominal retail sales rose further to 7.6% y-o-y in September, up from 5.5% in September and slightly above market consensus of 7.3% . This higher-than-expected growth in retail sales was partly driven by a low base effect, when China entered its last round of covid lockdown in Q4 2022. In sequential and seasonally adjusted terms, retail sales grew by 0.1% in October, after staying flat in the previous month and remained notably below pre-pandemic level of 0.7% (2018-2019 average) (Chart 1).
- The overall unemployment rate stayed unchanged at 5.0% in October, below the average reading of 5.6% in 2022 and 5.3% in Q1-Q3 2023 respectively, likely pointing to some improvement in the overall labour market condition in China.
- Industrial production (IP) growth inched up to 4.6% in October, from 4.5% y-o-y in the previous two months (Chart 2), and above market consensus of 4.3%. By sector, IP in the upper-stream material industries (including chemical materials and metals) continued to register stronger growth, while sectors related to infrastructure activities (including railway, shipping, transportation equipment and so on) also picked up notably, thanks to the stronger issuance of local government special bonds (LGSBs) since August 2023.
- Growth in fixed asset investment (FAI) edged down further to 2.9% y-o-y ytd in October, from 3.1% in September. According to our estimates, FAI slowed to 1.3% y-o-y in October, from 2.4% in September amid the persistent drag from the property sector, which stayed in deep contraction at -11.2% y-o-y in October.
- On the property front, while main indicators continued to stay at subdued levels, there are some initial signs pointing to a stabilisation in the housing sector.(Chart 3). According to Bloomberg’s report, the Chinese government plans to provide around RMB1 trn of low-cost funding to finance the urban village renovation (UVR) and affordable housing programs. In our view, this supporting measure, if well implemented, may improve local governments’ capabilities in resuming stalled property projects and accelerate the inventory digestion, hence restoring household confidence in the property market.
- On credit front, Chinese aggregate credit was largely in line with market expectation in October. Total social financing (TSF) came in at Rmb1,850 bn, with outstanding TSF balance growth rising to 8.7% y-o-y in October from 5.6% in September. According to our estimates, credit impulse turned positive to 0.4% in October, from -1.4% in the previous month.
- The growth in aggregate credit continued to be driven by stronger new government bond issuance (Chart 4), which came in at RMB1.6 trn in October amid the issuance of special refinancing local government bonds (to swap out LGFV debt in provinces with acute liquidity stress) and the front-loading of special local government bonds. Compared to a year ago, new government bond issuance rose by 228% (3mma).
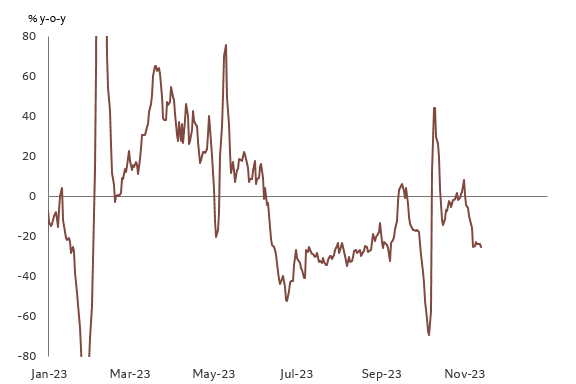
- In contrast, credit demand in the private sector remained soft (Chart 5). New long-term corporate credits contracted further to -15.3% y-o-y (3mma) in October, from 4.6% and -8.1% in the previous two months. Meanwhile, new medium and long-term household loans (mainly mortgage loans) dropped to RMB 71 bn in October, down from RMB 547 bn in September (Chart 6). While the October reading came in higher than a year ago (70.7% y-o-y), the overall momentum remained weak amid still subdued property sales (Chart 7) .
- All in all, most activity data released recently point to improved momentum in China, on the back of stronger fiscal stimulus. Credit impulse will likely rise further to around 3.7% by the end of 2023, amid the additional RMB 1 trn of central government bonds issuance in Q4. Household consumption may continue to recover at a moderate pace on better employment condition and income expectation, while the property sector will likely remain under pressure in the coming quarters before it stabilises. Our 2023 Chinese GDP forecast remained unchanged at 5.2%, but with risk slightly tilted to the upside.
Chart 1. Growth in nominal retails sales (m-o-m,sa)
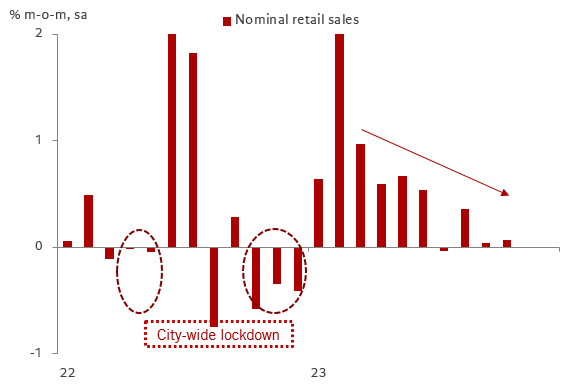
Chart 2. Growth in industrial productions (total and selected sectors)
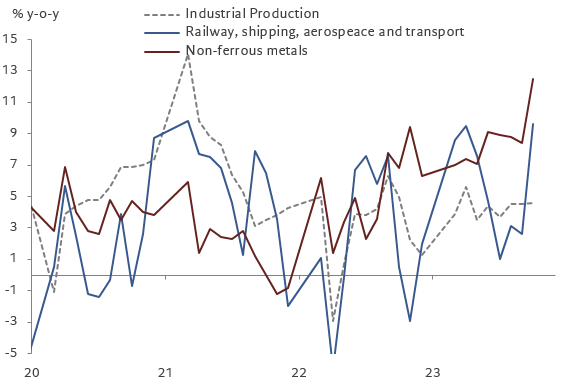
Chart 3. Growth in property investment and property sales
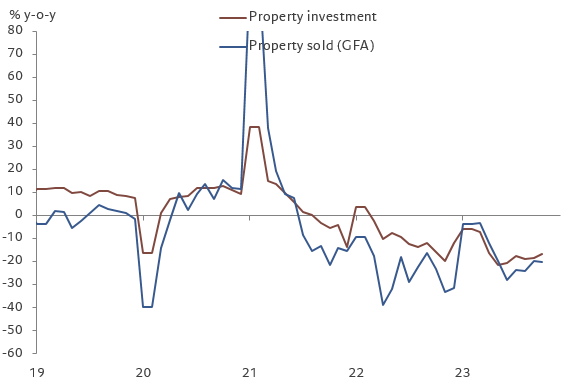
Chart 4: : New government bond issuance
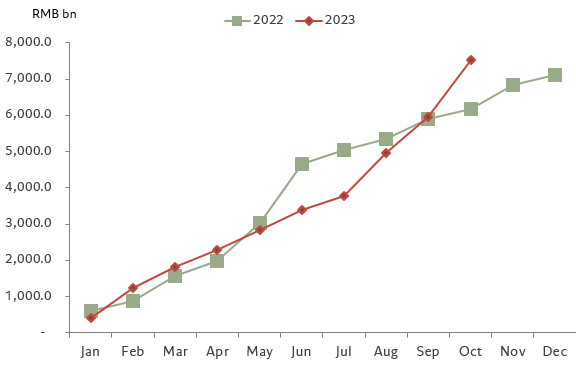
Chart 5: Growth in new household loans, corporate credit, and government bond issuance
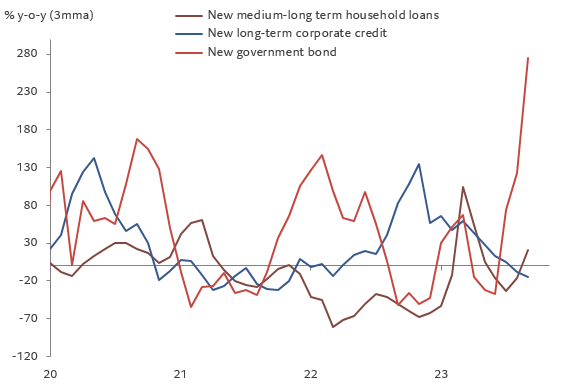
Chart 6: New medium to long-term household loans
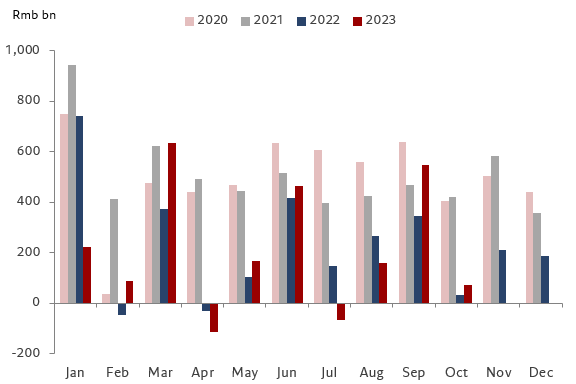
Chart 7: Growth in daily housing transactions in 30 major cities (7dma)